Emerging Europe
boasts lowest taxes & labor costs
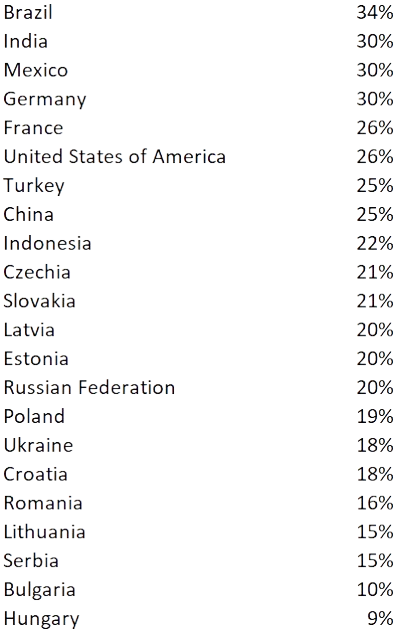
Corporate tax rates
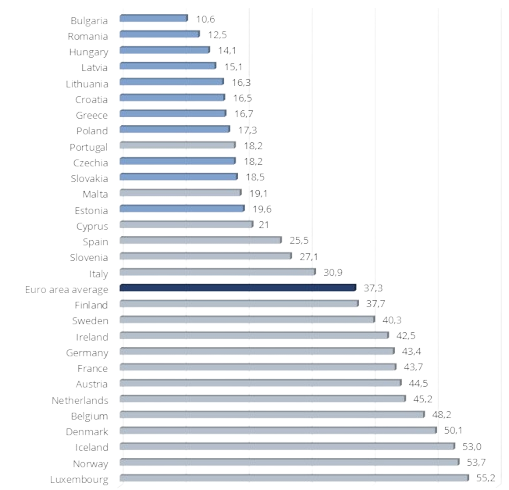
Labor cost per hour ( E ), 2017
Taxes much lower in CEE vs. developed world
States provide tax incentives & additional stimulus to attract foreign investors
While convergence has been driving income growth, wages are still far below European averages
Min wages range b/n €551 and €707 eur in Bulgaria and Hungary vs €2 161 and €2 193 eur for Germany and The Netherlands.