Why Emerging Europe?

Compelling opportunities in Emerging Europe

Emerging Europe
buoyant region converging with the rest of Europe

  • incubator for fast-growing companies
  • increasingly participating in European & global supply chains - vast number of companies shifting production here

Central & Eastern Europe is a diverse region offering appreciable scale:

  • 200+ mln combined population

  • USD 2.5 + trln
    GDP

  • 4,000+ listed companies

  • USD 1+ trln total market cap

Emerging Europe

among the fastest growing regions

Country Group Name

Subject Descriptor

Units

Scale

2018

2019

2020

2021

2022

2023

2024

2025

2026

2027

2028

2029

2030

World

Gross domestic product, constant prices

Percent change

Units

3.653

2.947

-2.667

6.605

3.645

3.493

3.292

2.785

2.963

3.216

3.216

3.179

3.121

Advanced economies

Gross domestic product, constant prices

Percent change

Units

2.284

1.872

-3.958

3.628

2.946

1.738

1.798

1.377

1.506

1.689

1.717

1.674

1.651

Euro area

Gross domestic product, constant prices

Percent change

Units

1.768

1.627

-6.016

1.220

3.533

0.401

0.855

0.806

1.185

1.348

1.297

1.204

1.129

Major advanced economies (G7)

Gross domestic product, constant prices

Percent change

Units

2.091

1.748

-4.216

5.816

2.617

1.852

2.593

1.228

1.379

2.119

1.625

1.595

1.568

Other advanced economies (Advanced economies excluding G7 and euro area)

Gross domestic product, constant prices

Percent change

Units

2.804

2.046

-1.585

5.917

2.781

1.845

2.236

1.766

3.507

2.157

2.152

2.057

2.044

European Union

Gross domestic product, constant prices

Percent change

Units

2.283

2.044

-5.514

6.421

3.668

0.596

1.116

1.156

1.478

1.605

1.563

1.789

1.434

ASEAN-5

Gross domestic product, constant prices

Percent change

Units

4.951

4.209

-4.416

4.073

5.492

4.072

4.634

3.966

3.947

4.216

4.342

1.726

4.523

Emerging market and developing economies

Gross domestic product, constant prices

Percent change

Units

4.674

3.738

-1.736

7.038

4.134

4.685

4.284

4.584

3.888

4.162

4.123

4.069

3.971

Emerging and developing Asia

Gross domestic product, constant prices

Percent change

Units

6.424

1.363

-0.503

7.754

4.677

6.054

4.572

4.535

4.602

4.848

4.587

4.677

4.508

Emerging and developing Europe

Gross domestic product, constant prices

Percent change

Units

2.380

2.522

-1.756

7.097

0.5

3.567

3.369

2.091

2.145

2.341

4.575

2.471

2.533

Latin America and the Caribbean

Gross domestic product, constant prices

Percent change

Units

1.134

0.16

-6.877

7.429

4.208

2.399

2.371

2.014

2.387

2.708

2.712

2.706

2.551

Middle East and Central Asia

Gross domestic product, constant prices

Percent change

Units

2.670

3.141

-2.199

4.356

5.452

2.245

2.419

2.956

3.539

3.975

3.695

3.668

3.738

Sub-Saharan Africa

Gross domestic product, constant prices

Percent change

Units

3.302

3.203

-1.544

4.685

4.125

3.589

3.986

3.818

4.187

4.317

1.580

4.568

4.534


* Source: International Monetary Fund, World Economic Outlook Database, April 2025

Emerging Europe
boasts lowest taxes & labor costs

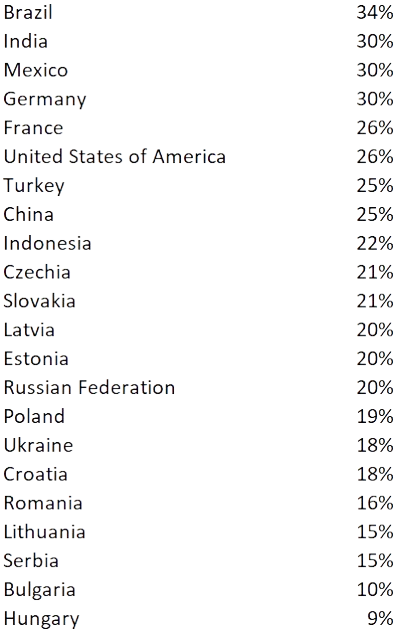
Corporate tax rates
Labor cost per hour ( E ), 2017
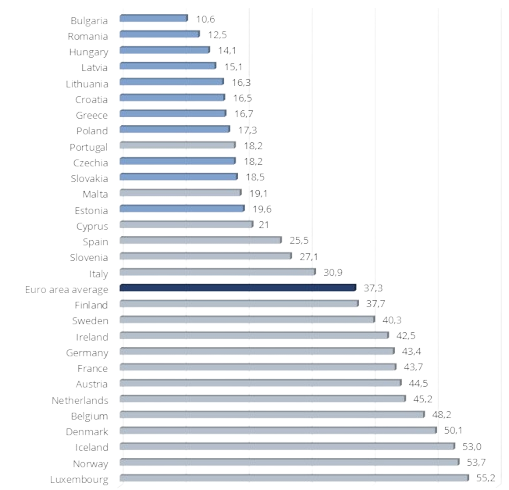
Taxes much lower in CEE vs. developed world

States provide tax incentives & additional stimulus to attract foreign investors

While convergence has been driving income growth, wages are still far below European averages

Min wages range b/n €551 and €707 eur in Bulgaria and Hungary vs €2 161 and €2 193 eur for Germany and The Netherlands.
Emerging Europe
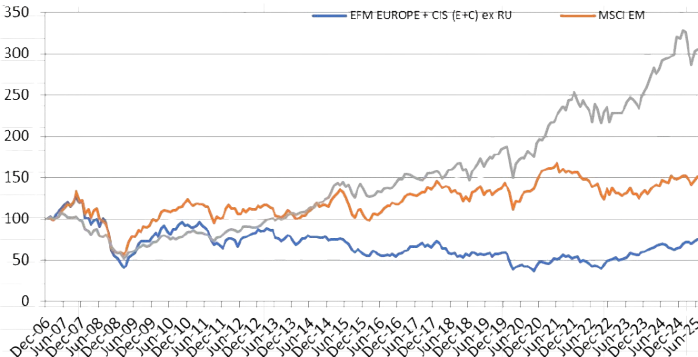
stock markets lagging behind

 
 MSCI EFM
Europe+CIS
ex RU, €
30.06.2024
1Y8.42%
3Y,
annualized
21.02%
5Y,
annualized
10.95%
10Y,
annualized
0.54%

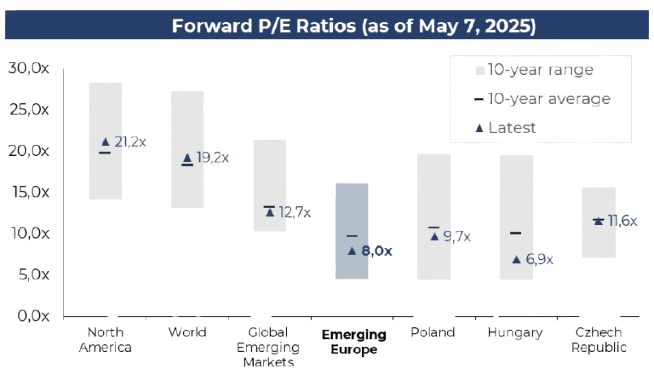
Emerging Europe
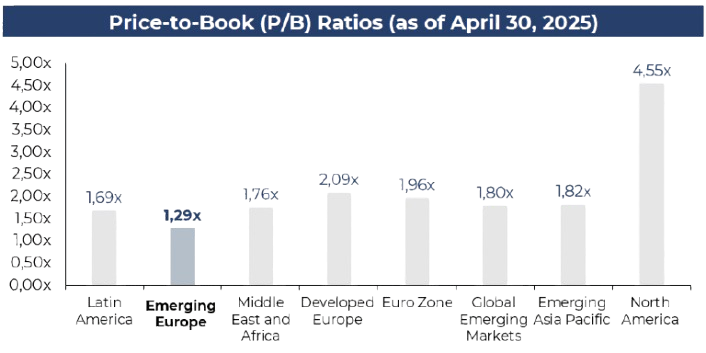
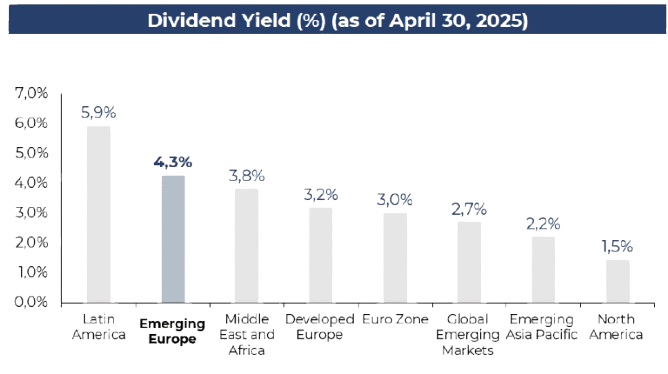
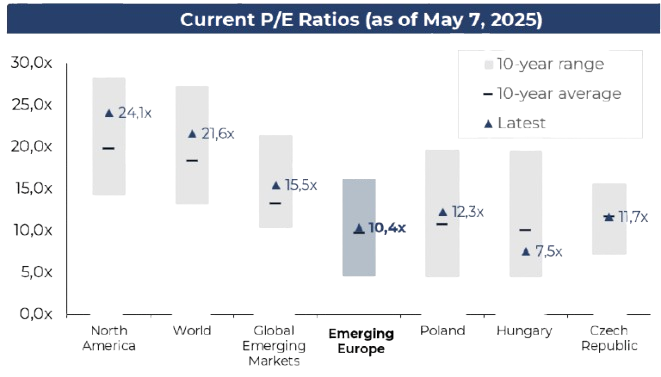
compelling valuations

FORWARD P/E

P/B, MRQ

DIV YLD

P/E PER COUNTRY, TTM

Our Global Partners and Clients

Over 20 years we’ve built a solid reputation as a reliable partner – our relationships with clients and partners are based on mutual trust and alignment of interest. We work with various local and international institutions in helping clients tap into the potential of Emerging Europe. We establish deep and enduring relationships with our clients to fully understand their unique investment needs.

Since 2012 we represent one of the top global asset managers, Schroder Investment Management (Schroders) in the markets of Bulgaria and Romania. Starting August 2025 we also represent Goldman Sachs Europe, offering their structured products to Bulgarian clients.

Our UCITS funds are offered to investors in Switzerland and Korea via the representation services of Waystone Fund Services and HDC (Hyundai) Securities, respectively.